Introduction
If you ever go do software development for a big company, you’ll inevitably have to deal with metrics related to development velocity. This is reasonable - companies that are paying people to make software for them want to understand how the money is being spent. The question is, effectively, what rate is money being converted to functional software?
Even though we’re not paying our students to write software (ah the dream…), development velocity is still a huge thing. Of course, it’s primarily driven by the competition deadlines - you have finite time between receiving the challenge, and having to produce functional software for the robot. Additionally, even within this time constraint, there’s multiple teams who need to work on the robot. Every hour spent debugging software on the robot is an hour that could have been spent improving a mechanism, cleaning up some wiring, or getting drivers more time to practice driving the robot.
The bottom line: For most forms of software development, it’s worthwhile to invest in development processes and tools. This meta-development is a way to ensure you’re making progress as fast as possible. This often involves scripting repetitive build processes, using code-generation design paradigms, utilizing integrated development environments, and using a plethora of industry-standard tools for getting multiple computers to do your work for you at the same time. Companies often have separate teams that manage this environment in which software is developed.
For embedded controls software development, there are two major portions of the software development cycle. One is writing the software itself, but the other is tuning1 the software on the actual robot. Most folks have done this already - especially if you’ve tried a PID or anything similar, you’re at least aware of these two modes of software development. Depending on your industry, these two processes may be tied at the hip and done by the same people. ALternatively, they could be done by people who never talk to each other, on opposite sides of the world. Despite the variety of how the work is divided, The two share the same requirement of development velocity.
There are some very unique challenges to the tuning process that lead toward the need for a specialized toolset. For one thing, you need to view how values change in “real time”. You can’t quite halt the behavior of the robot physics like you can with software execution and a single step debugger. You also only manipulate a subset of the software’s functionality during the tuning process, which implies you don’t want a “full-blown” build and re-deploy process to get the job done.
With this in mind, it’s worthwhile to analyze toolsets that support the development process they’re doing. WPIlib, especially in the vsCode era, does an absolute bang-on job of delivering effective tools for both software development and tuning. The solution that Casserole uses, and I’ll describe here, was started back in the Eclipse era, when the tools still had a number of gaps that we wanted to solve.
We’ve continued to develop them and stick with them - we’ve invested the time, and it’s not been too much of a pain to maintain. Combined with the fact that they’re designed around our exact development process, it’s been worthwhile to continue down the current path. That very well may change, even in 2021, as better and better tools are developed. All to be seen. Still, the lessons learned and architecture chosen are worthwhile to document, and it’s a fun non-traditional robotics project for any of you go-getter students.
The World Model
The best way to understand the system we put together is to start with how we model our world of “software development”.
Separating Data from Code
As mentioned, there’s fundamentally two categories of work that get done related to software.
One is actually writing the logic that controls the robot. Which joystick goes to which motor, which button controls the intake, which autonomous path happens before the arm gets raised…. things like this are definitely in the realm of what people traditionally think of when you describe the “software developer” role. It’s done through writing code (in Java, for us), running it on some computer, stepping through it with a debugger, injecting test inputs, and making sure the outputs correspond to your expectations.
The other step is tuning. Here, we assume the logic has been written and tested. We’re looking to empirically discover (or at least confirm) what exact values for constants need to be in the software. The most universal example of this is in PID controllers: the P, I, D (and maybe F) gains are just numbers that you have to figure out, and prove that they work on the real mechanism. There’s other examples too: thresholds and debounces are another common one for us. How many samples of “button pushed” do we need to confirm that, yes, the operator does in fact mean to command the arm upward? How many RPM of error is acceptable before our shooter wheel is “ready”?
Subtle, unexpected disturbances in the mechanism mean it’s not usually practical for the average FRC team to completely and totally determine these up front. That means that at least some time will be spent working on the actual robot, solving for the best values for these constants by some educated guess-and-check methodology. That educated process will definitely have some up-front work to make reasonable guesses, but (at least for us) always requires some iteration on the actual robot.
The V-Chart of Development Flow
Visualizing this data/code separation is most easily done in my mind through the classic “V” model.
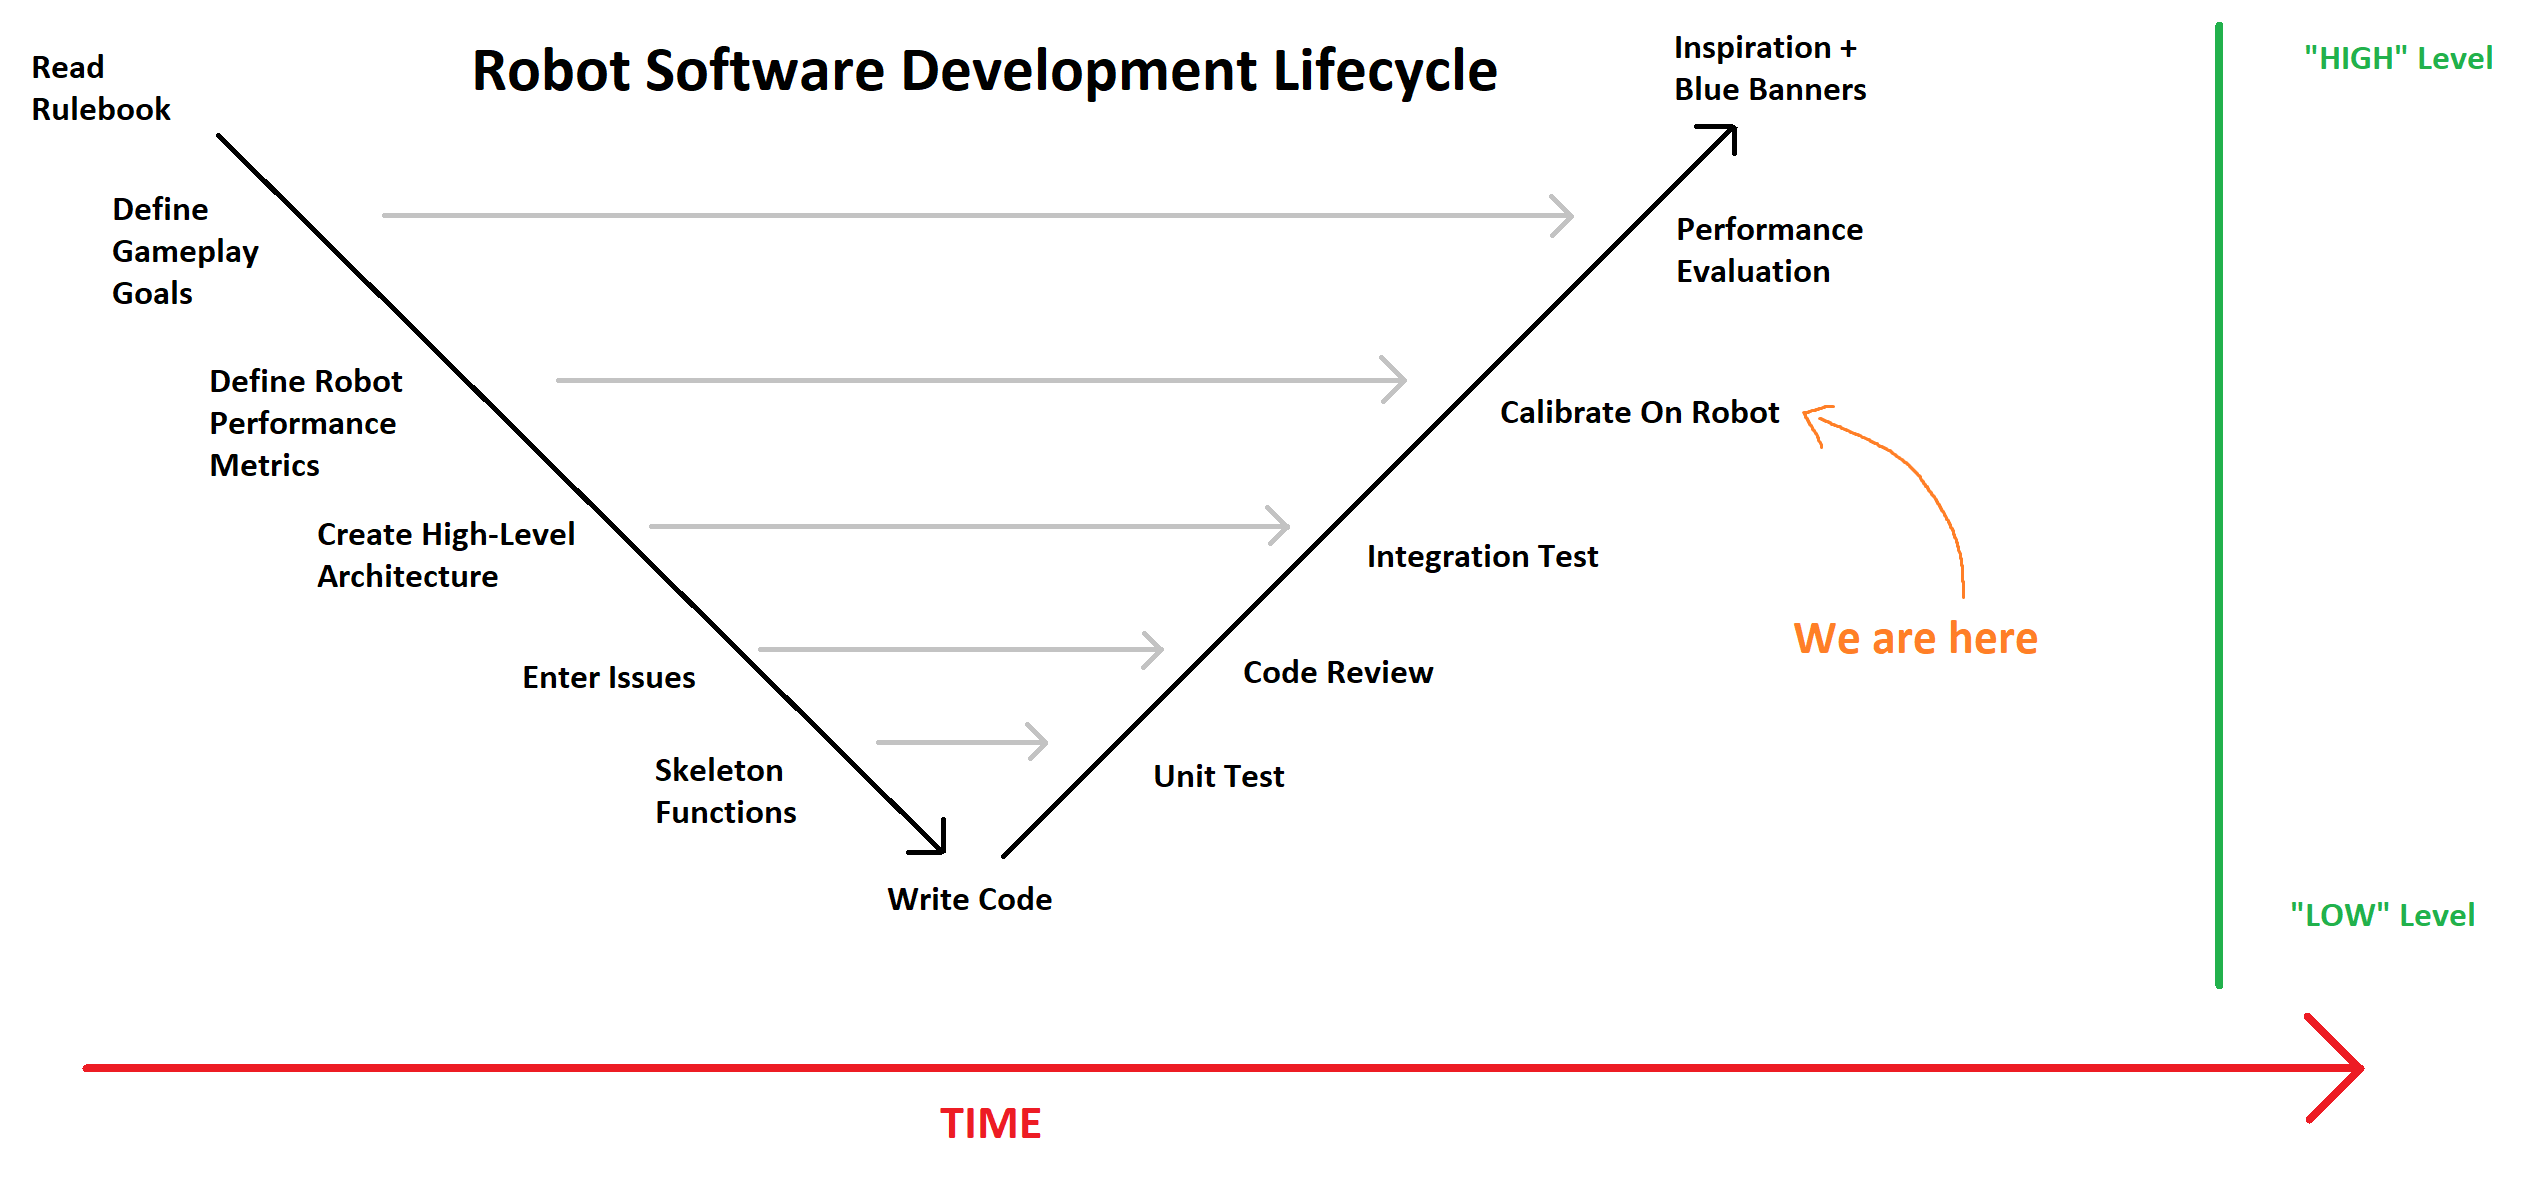
There’s a lot to be said about it, and you can do so here. We won’t do too much to delve into its nuances at the moment, but the key takeaway: The code that is written is derived from basic assumptions about how we want the robot to work. Data is anything derived from specific knowledge that is only available on the physical robot itself. It’s where the software world concretely starts to bridge back to the robot performance that was desired from gameplay goals.
There should probably be a whole blog post on this model of thinking about software development. But this, alas, is not that post.
Motivation
The Need for Tuning Tools
The fact that the “software development” task is sliced into this two-part model is what drives the need for unique tools, above-and-beyond projects which don’t require the tuning portion.
It’s a question of volume. Arguably, you could say all programming projects have some aspects of tuning to them…. at least the portion of picking constants. What I think sets certain projects apart is the amount of time needed to determine what constants to pick. If there only one and you can guess it on the second try… well, you don’t need a special toolset to do it. Just recompile your code twice and move on.
However, if there’s 500 things to tweak, and the tuning process will take multiple days, well…. maybe it makes sense to invest a bit of time into the toolset to facilitate that workflow. For FRC robot development in particular, our team tends to be in that “toolset needed” bucket.
“Non-Uniqueness” of Robot Software Development Problem
It’s worthwhile to note that the solution described here is far from the only answer for supporting the “tuning” portion of the development cycle.
ATI Vision and Vector CANape are two excellent tools used for calibration on vehicles of all types. However, both are purchased products and closed source. Additionally, in my experience, their toolchains tend to be built around the assumption of total-silicon-ownership, which is not something we have. It’s not that it’s a requirement, but there’s some workarounds required, which makes them less than plug-and-play for FRC purposes today…. thought that could change in the future.
Shuffleboard is the FRC-supported tool for changing constant values and viewing data at runtime. It’s leaps and bounds beyond the capabilities of the old SmartDashboard tool, and will likely satisfy the needs of most (if not all) FRC teams. It works over NetworkTables, the defacto standard for inter-processor communication in FRC.
With a handful of teams rolling out ROS-based robots, its also notable that the infrastructure ROS forces helps greatly in accomplishing the goals of the “tuning” portion. Visualization packages already exist and are well supported, along with a nifty data-holding structure that makes simulation and replay quite nice. But, of course, to use it, you also have to be using ROS.
This is far from an exhaustive list, but should serve to show two things:
- Casserole’s answer is far from “a general necessity”
- There are a lot of requirements to consider, and a lot of existing answers.
“Uniqueness” of Robot Software Development Problem
It’s worthwhile to note the roboRIO and our chosen language of Java bring unique things to the table. For one thing, we have the benefit of a full Ethernet network stack, Linux OS, shell, and filesystem. On the other hand, this means we don’t have the “full silicon ownership” that you get from other styles of embedded code development (ex: Arduino…. sorta). Lacking that direct tie to “object in memory”, it means lots of the industry-standard calibration tools won’t quite fit the bill….. but it does mean that lots of less-common solutions are much easier to implement.
Finally, we’re under fairly extreme timeline crunches, and working with teams of developers who are trying to learn all this at the same time.
Taking all of these things together, we’d decided in summer 2016 to go ahead with a fully custom solution.
Specific Requirements
When we went about designing our system, we started with an assessment of what worked well in the past, and what were pain points.
Analysis
The biggest deal-breaker was that, at the time, we couldn’t figure out how to get Shuffleboard’s calibration value interface to work robustly. We were constantly guessing as to whether the new values had made it to the robot, and even lost a match due to a calibration change that didn’t get propagated properly.
In addition, the timeseries graphing was cumbersome, and didn’t allow the flexibility we wanted to quickly analyze data. Finally, the layout of the visualization had to be stored in a separate file on the development computer. This forced an non-obvious, two-points-of-change any there was a new value or a modified name.
What we did like was that you didn’t have to know a separate programming language to add or use the dashboard interface. Keeping the configuration in the source code as much as possible was deemed important, to minimize the mental load on already-stressed students.
From these and other more minor requirements, we defined a “model” of the world to inform our tool design. Namely:
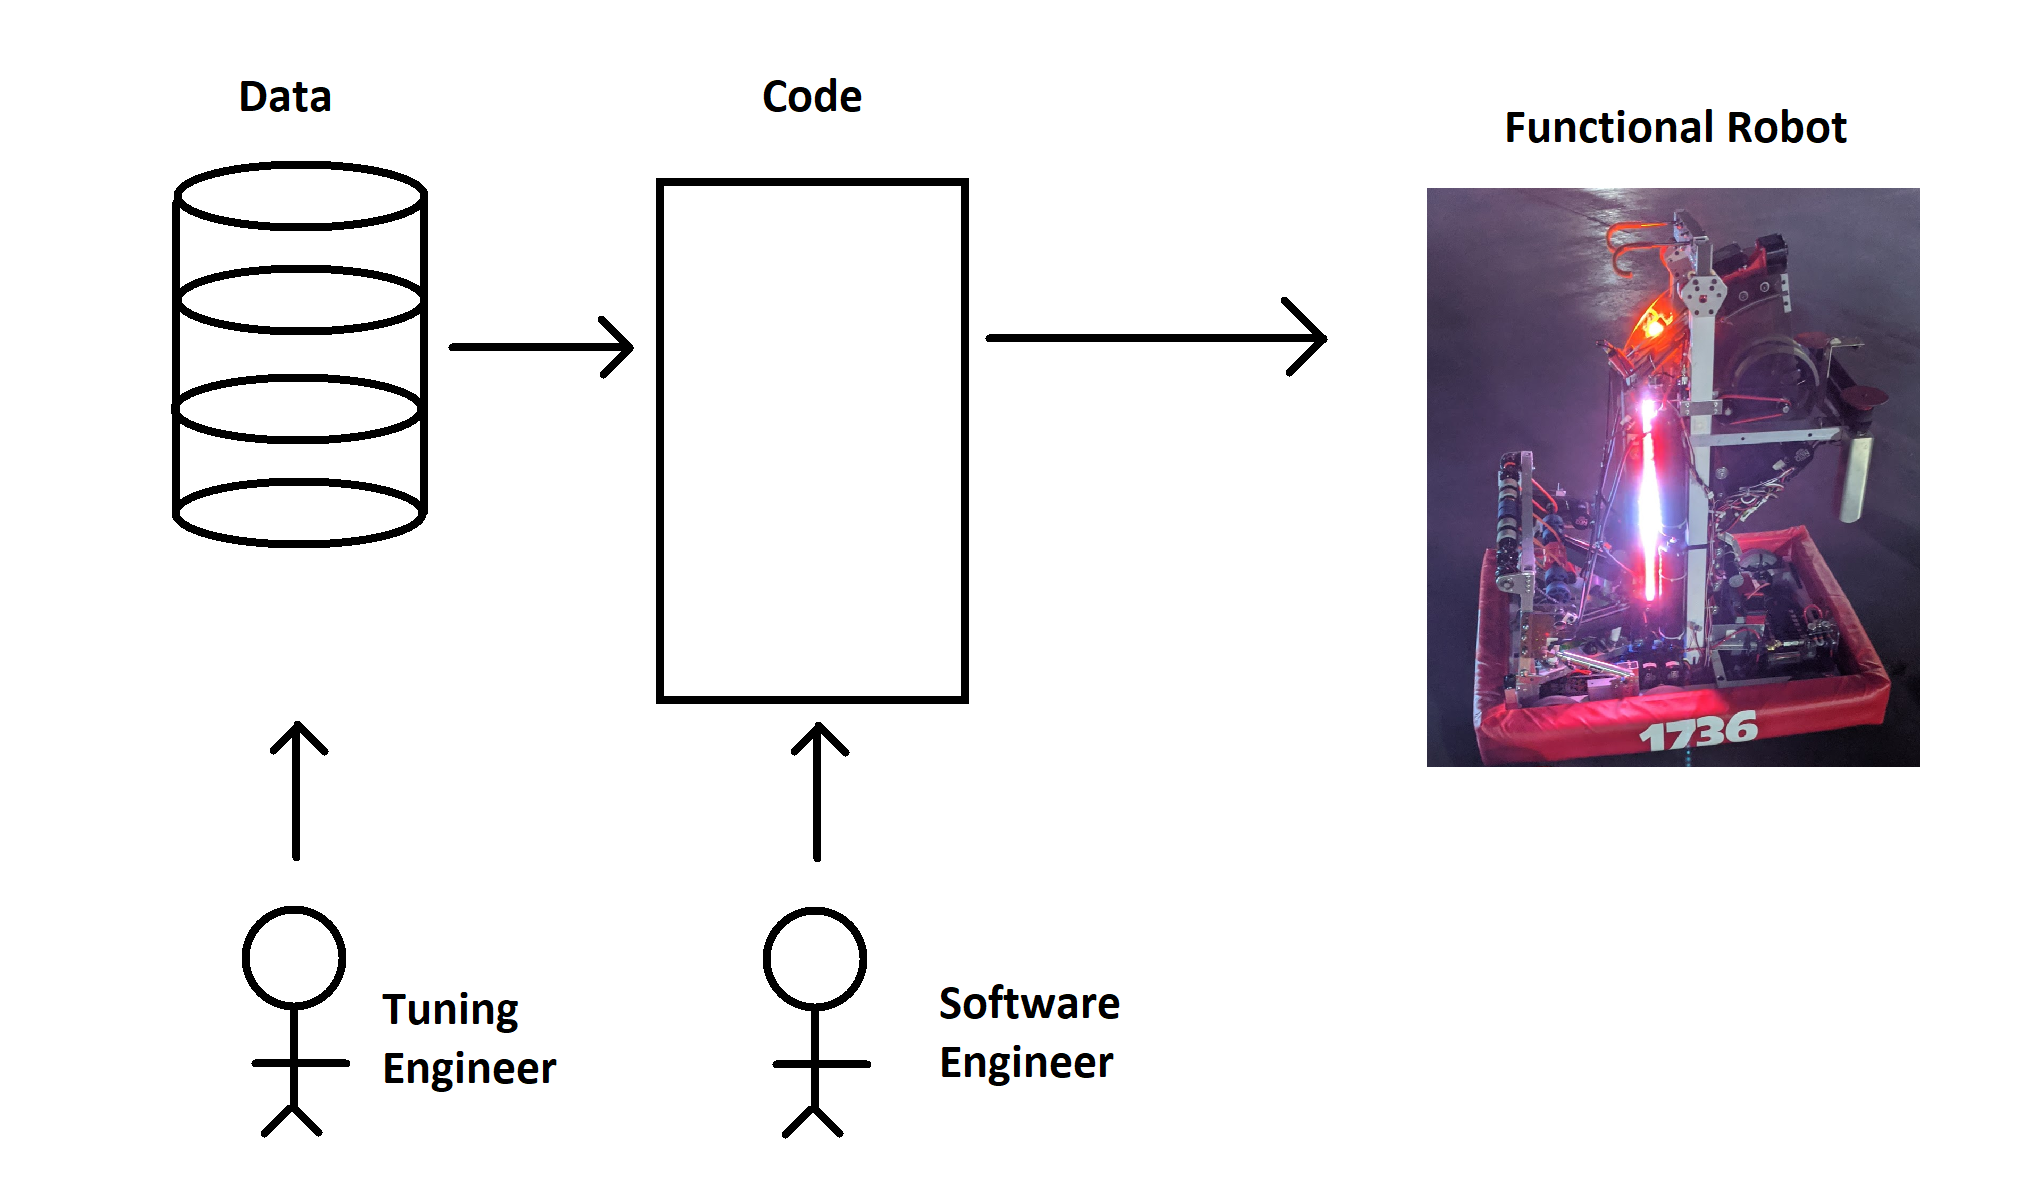
- We divide work done by “Software Engineers” from “Tuning Engineers”. Though frequently the same actual person, we try to divide the work and job role as much as possible.
- We create software constructs that allow the Software Engineer to bridge the robot to the Tuning Engineer. “Calibrations” form the engineer->robot bridge, while “Signals” form the robot->engineer bridge.
- The Software Engineer chooses where to apply the calibrations & signals in the software implementation step to provide “just the right” number of “knobs” for the Tuning Engineer to use. The Tuning Engineer uses those knobs to get the robot working as desired, and feeds the values back to the Software Engineer.
Calibrations
A calibration is a code object which represents a number that can be treated as some numeric constant by software implementation, but should be easily and rapidly adjustable during the tuning process, without rebuilding and reloading code.
Software Developer Interface
Calibrations must support a software-facing .get() method where the value is returned to the code at runtime. They must support a set-like ability in some software-developer-facing interface, along with things to make it easier for humans to interact with. This includes a nice English description of the purpose of the calibration, physical units (if applicable), and (optional) min/max reasonable values.
Tuning Interface
The user-facing interface would need to allow a software developer to rapidly enter new values for these calibrations, and save/restore values over code restarts. This is to ensure a mid-tuning battery swap doesn’t wipe out a few hours of work.
Back-end Requirements
All the heavy lifting of file-read and cal value change must be done at init time, to ensure runtime code execution time is as deterministic and small as possible.
Multiple people might be tuning at the same time - data has to be accepted from multiple simultaneous tuning clients, and synchronize between multiple tuners.
The save/restore functionality leverages a text file stored on a USB drive, which allows for quick swaps between hardware if needed. We prefer the little nubby ones that have no mass to cantilever and vibrate and prematurely weaken the port.
Signals
A signal is a code object which represents the value of some meaningful state on the robot. Usually it’s tied to some physical measurement (ex: left drivetrain wheel velocity in RPM), but it can be more abstract (ex: current step in a sequence of 10 things to do in an auto routine).
By recording these timestamped values, analyzing software behavior via signals can be considered the “next-step” beyond single-step debugging. It’s not looking at how single lines of code interact at one instant, but how larger chunks of code interact over time. From this sense, it’s not to be a replacement for other debugging forms. It just fills the niche for debugging a program which is running in real-time, without stopping the program.
Software Developer Interface
Signals must present a clean software-facing interface, which we call .addSample(). The software developer writes the logic in such a way as to provide a meaningful value and timestamp at runtime. Usually this “new-value” providing happens once a loop. However, since robot code often involves multiple asynchronous loops running in parallel, not all samples are guaranteed to be added at the same rate.
Tuning Interface
Signals must be presented to the Tuning Engineer in a meaningful way. For us, this means a “timeseries” plot, or a cartesian plane with the X axis representing time, and the Y axis representing signal value.
Software developers are forced to provide both an “English” name for the value, as well as the physical units of the value. Physical units are matched on the display side to help ensure like-things are plotted together (ex: all RPM can show up on the same Y axis). It’s not a perfect mechanism, but gives the Software Engineer an appropriate degree of flexibility to produce meaningful graphics for the Tuning Engineer.
Back-end Requirements
Signals need to be able to retain a history of values, since the change of the value over time is often of interest. Signals also need to have some notion of timestamping - end users will care when the signal had a particular value.
Signal data will be consumed by multiple simultaneous readers, all looking for data at a different rate. Driver dashboard, timeseries data plotters, a flat list of “robot state” values, log-to-file functionality…. Each consumer will have particular requirements on what data it wants and when, and the signal will have to deliver to all of them.
The consumers need to have the ability to configure what data they get out of the signal to ensure network bandwidth is only used as needed. Every sample transferred over Ethernet should get displayed meaningfully to the end user.
Two examples: A flat list of values in a gird that updates every 500ms only needs each value every 500ms - the in-between values should not be transferred. On the other hand, a time-series plot of three signals needs every sample, but only from those three signals. No others should show up on Ethernet.
To facilitate this, signals are configurable to send data with TX rate and decimation specs. TX rate impacts how frequently samples are sent out over the network. Decimation impacts how many samples are skipped in each transmission.
To ensure we don’t use up too much memory at runtime, Signals are informed which clients are asking for their data, and how (tx/decimation). Using this info, the signal can internally determine which samples need to be retained in memory (will need to be sent to at least one client), and which can be “garbage collected” (already sent to every client that cares). This dynamic allocation/deallocation of memory is not optimal for embedded systems, but we chose to do it in a focused manner. When zero clients are hooked up (usually what happens on the field), no storage or allocation happens at all. Memory and sample count is tracked at runtime, so we can detect and fix problems if needed.
This helps us meet our goals of runtime efficiency as well - when no clients are looking for the data, the .addSample() should be a no-op. The .addSample() operation is designed to be as lightweight as possible, with the “send-to-clients” operation taking the brunt of the organizational work (and running in a lower-priority background thread). Since we’re using a queue paradigm to store and send data, the rate at which data shows up on the Ethernet link only matters to ensure visual displays stay nice and responsive on the Tuning Engineer’s side. No data is lost if the server happens to miss a tx deadline, it just gets put in the next data packet.
Joint Requirements
Even though Signals and Calibrations serve different purposes (different directions in the robot/Tuning Engineer communication), we wanted them to appear as part of a single toolset as much as possible.
Taking a hint from some work that 254 had done in prior years, we decided to do a web-based user interface for the Tuning Engineer. This has a number of advantages:
- Cross-platform and no extra install: Any computer with a web browser and Ethernet/WiFi connection can be used for tuning. And, tablets make you look cool.
- Sits on top of the already-required Ethernet network on the robot.
- Flexible GUI design to ensure interaction is smooth, consistent, and easy.
Conveniently, when desktop simulation started being more of a thing in 2019, this architecture dovetailed well - actually, the webserver “just worked”. We had to adjust a few paths in simulation to account for the fact the desktop filesystem wasn’t the same as the roboRIO’s. But, otherwise, a desktop pc can host the same web interface on localhost as the roboRIO.
The ease-of-use and visual consistency were important to us in the development process: Remember the primary users of this are students who have never done something like this before. We need the tools to be (and look) simple and effective. They should help guide, but not constrain or hinder, the thought process of the user. Visual simplicity and obvious workflow were key requirements to ensuring our perpetually-green users would be able to use it effectively.
Server-Client Architecture - Signals
Our desire to tie the design to a queue-paradigm (timestamped staples sent asynchronously of capture time) meant that Network Tables wasn’t going to quite fit the bill in 2016 (though, as of writing this post, it is rapidly evolving to where it would be a drop-in replacement for what we designed). From that, we knew we’d have to custom-define the communication that took place between the roboRIO, and whatever device loaded the tuning toolsuite webpages.
Server Design
We took another cue from 254’s design of years past. Since we were using Java as our development language, and didn’t anticipate changing any time soon, we went ahead and implemented our server in Java. This involved using Jetty, a common server for HTTP and Websockets, two protocols we knew we’d need.
The server is actually two part: One which serves Signal Data, and one which serves HTTP and everything else.
Both use Jetty to divide up the server’s functionality by page, and serve the files from the WWW folder deployed to the robot.
Websockets API
The basic flow of information starts the same way as any other static website: The web browser is navigated to the appropriate page (roboRIO’s IP address + 5805 port), and the robot returns the appropriate .html/.js/.css files. The client web browser displays the page and starts running the javascript.
At this point, we need to start transferring additional data between the robot and the client web browser, depending on what the page is supposed to display, and what the user wants to do. To facilitate this communication, we used Websockets as the underlying protocol, with a messaging scheme largely informed by the requirements above, and guided by concepts the ASAP2 Can Calibration Protocol, whose workflow we were roughly emulating. JSON was chosen to organize the data as it was passed back and forth between client and server.
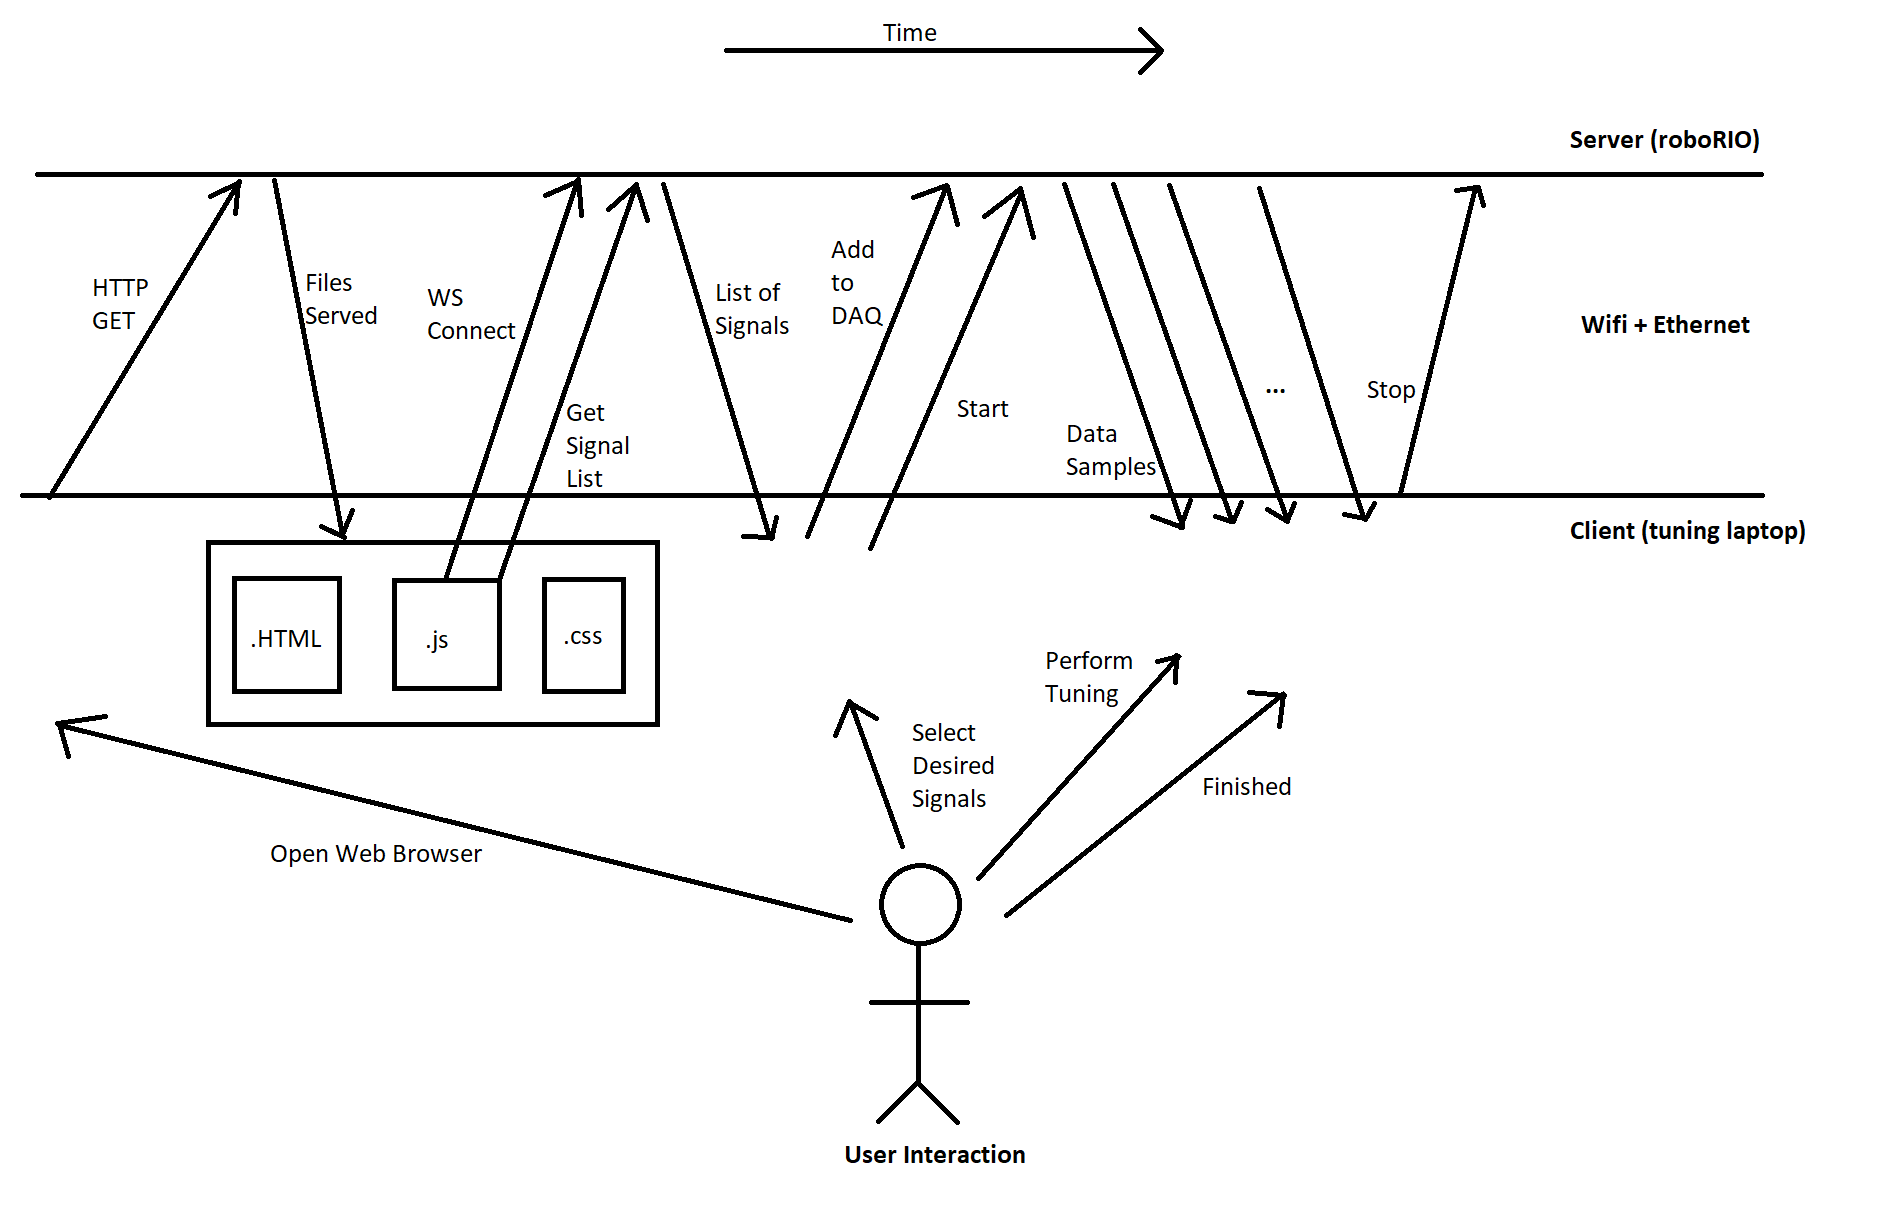
After the website loads and the client PC establishes a connection to the Signal Data server on the RIO, it queries for the list of signals which the robot presently supports. The RIO responds with a list of all signals & units, which it has derived from all Signal objects declared (so far) in the code execution.
The calibration website will display this list of signals to the user (ie Tuning Engineer), and (usually) allow the user to select which signals are of interest.
As the user selects signals, the client sends messages to the robot asking for the signals to be added to a “DAQ List”. This is just the list of signals the roboRIO will need to transmit to the client at a regular rate. Signal tx rate and decimation are also specified.
Once the user has completed selection, the client sends the “start” command to the robot. After this, it expects the roboRIO to send out data packets containing timestamped values for all the requested signals, at the specified interval and decimation.
This data transmission will continue until the desired data has been gathered, and the Tuning Engineer causes the client PC to issue the “Stop” command.
After this, the user may request to restart data transmission, clear the DAQ and start over, close the webpage…. many different options.
The key design component we wanted from this was that the client would slowly and asynchronously configure the server first. Then, after “start”, the server would send packets as close to requested as possible, but not be dependant on a client-clocked “give me data now” signal. The goal was maximum flexibility on the server end to prioritize real-time code requirements over data visualizations. And, it cuts down on network traffic, when it’s always expected that data transmissions will be periodic. It’s not the only way to accomplish this, but happens to be the way we chose…. and stuck.
All of this work is done in background threads of fairly low priority. This is done intentionally to ensure the embedded code with real-time requirements is serviced first, then website-related things second. We also put in architecture to ensure the website could be fully disabled if it started causing issues, without modifying the embedded code. Though, to date, we’ve not had to do this.
Client Designs
This design allows the client sides to be pretty flexible.
We’ve built up client webpages to display very-granular timeseries data in real-time using Highcharts 2. We customized the UI to be as close as we could get to tools the mentors on our team were used to (namely, the aforementioned ATI Vision and Vector CANape).
We also built a very basic “display all values” page, which is good for quick debug.
There’s also a “driver dashboard” website, though it requires a bit more custom support (as the values displayed need more metadata to describe the graphical “widget”).
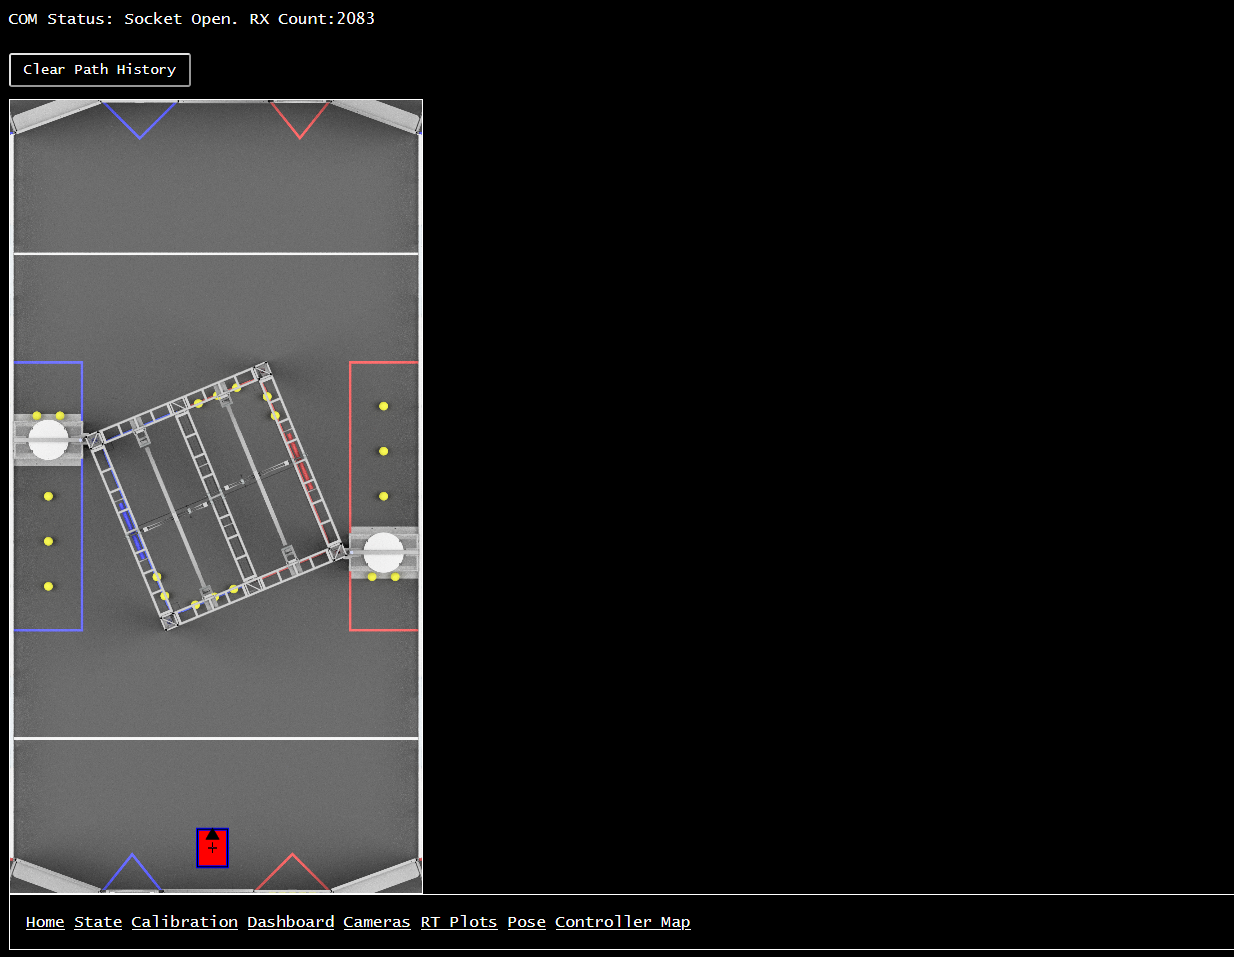
Finally, we also built up a quick-and-dirty robot pose display, which uses a few special-named signals for robot X/Y/Angle pose (both desired and actual). It’s mostly useful for visualizing autonomous routines prior to getting on the actual robot, as well as a quick visual indication of how well the odometery is working on the real robot.
Server-Client Architecture - Calibrations
The Calibrations side of the server is much less remarkable than the signal and data-acquisition side. It uses the same html/.js/.css and websockets infrastructure as signals, but with a modified protocol.
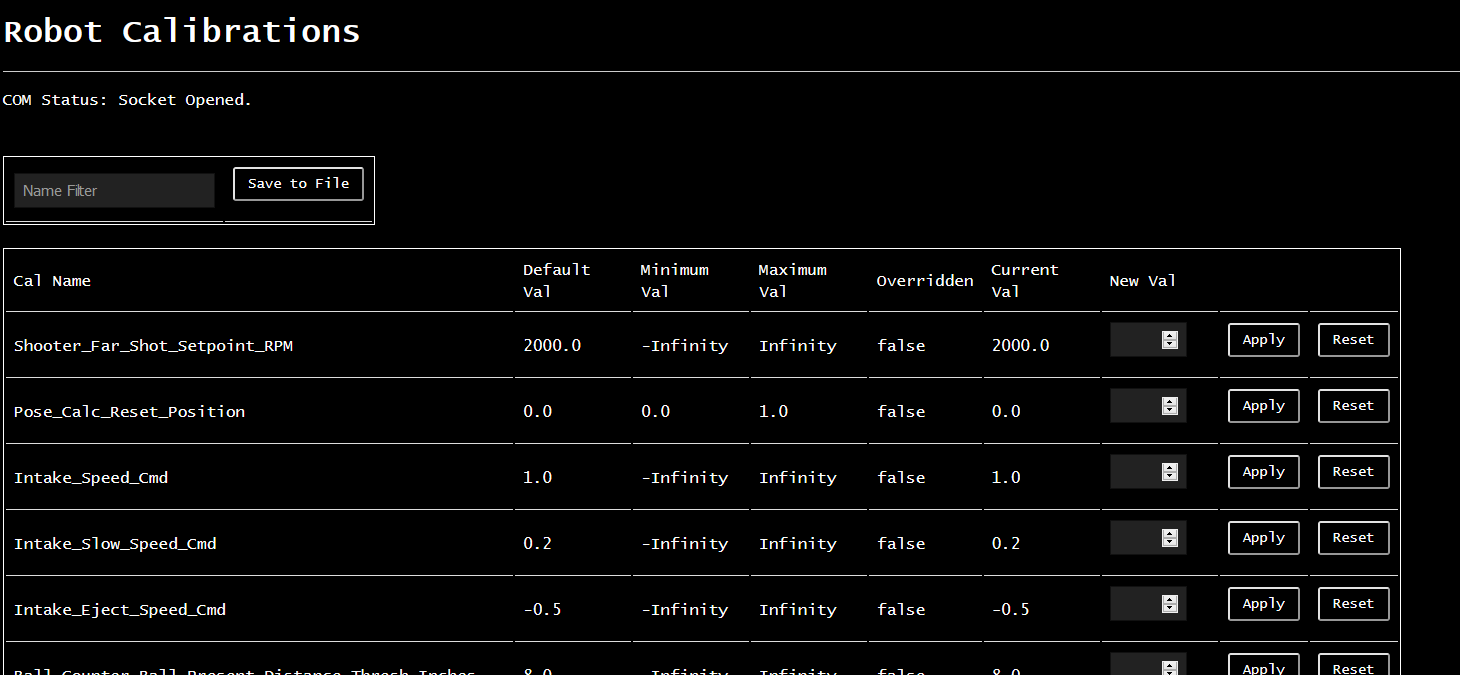
When the client connects, it gets a list of available calibrations instead of signals. This information includes names, units, min/max values, and default values. It displays this info in a tabular format. Whenever the Tuning Engineer changes a value, it simply transmits the data in a one-shot fashion back to the roboRIO, and assumes the value got updated.
Future work includes a periodic update from server to client to ensure the client always reflects the server’s state…. but so far, it hasn’t been a hinderance to the workflow.
End Usage - On the Practice Field
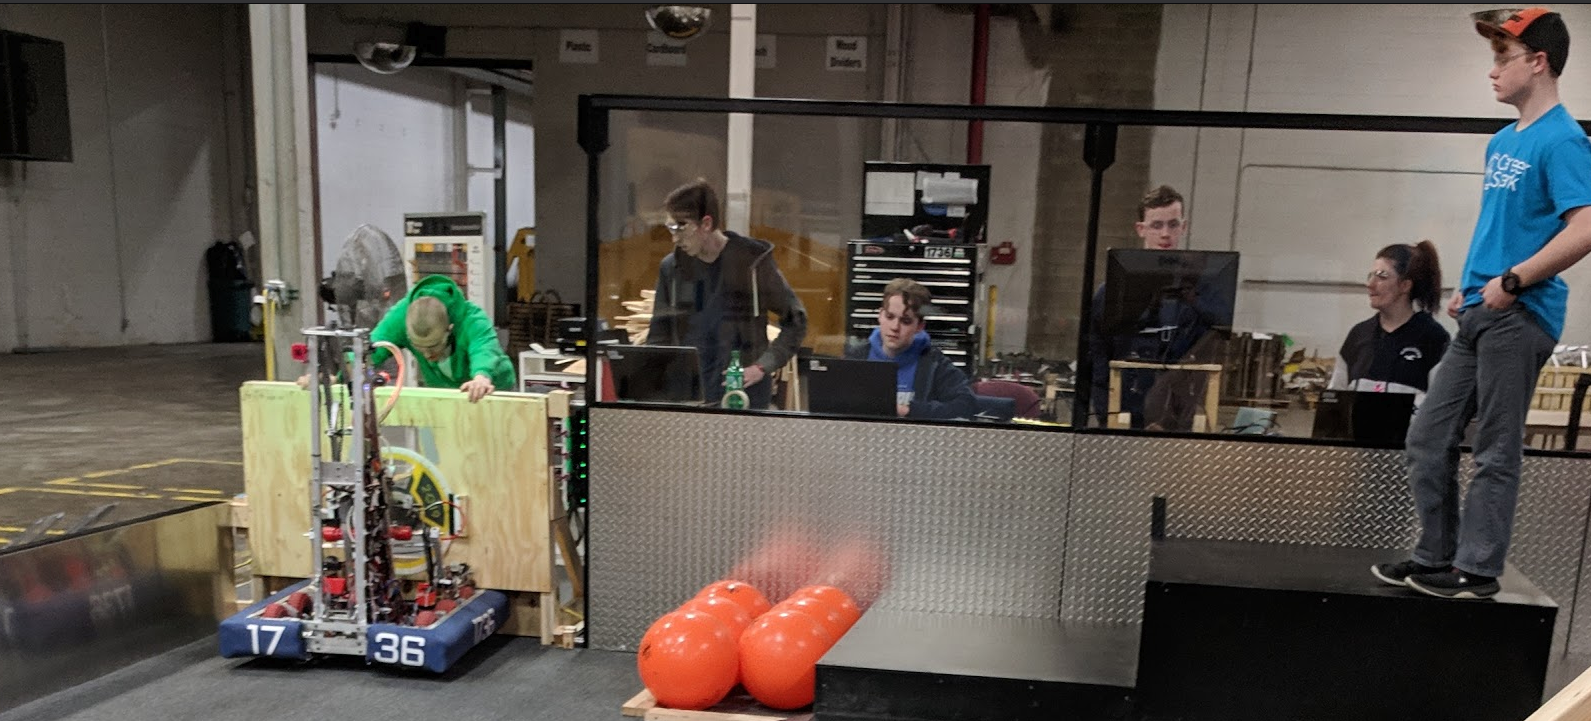
The vast majority of the usage this system sees is when we’re on the practice field, debugging software and dialing in performance of the actual robot.
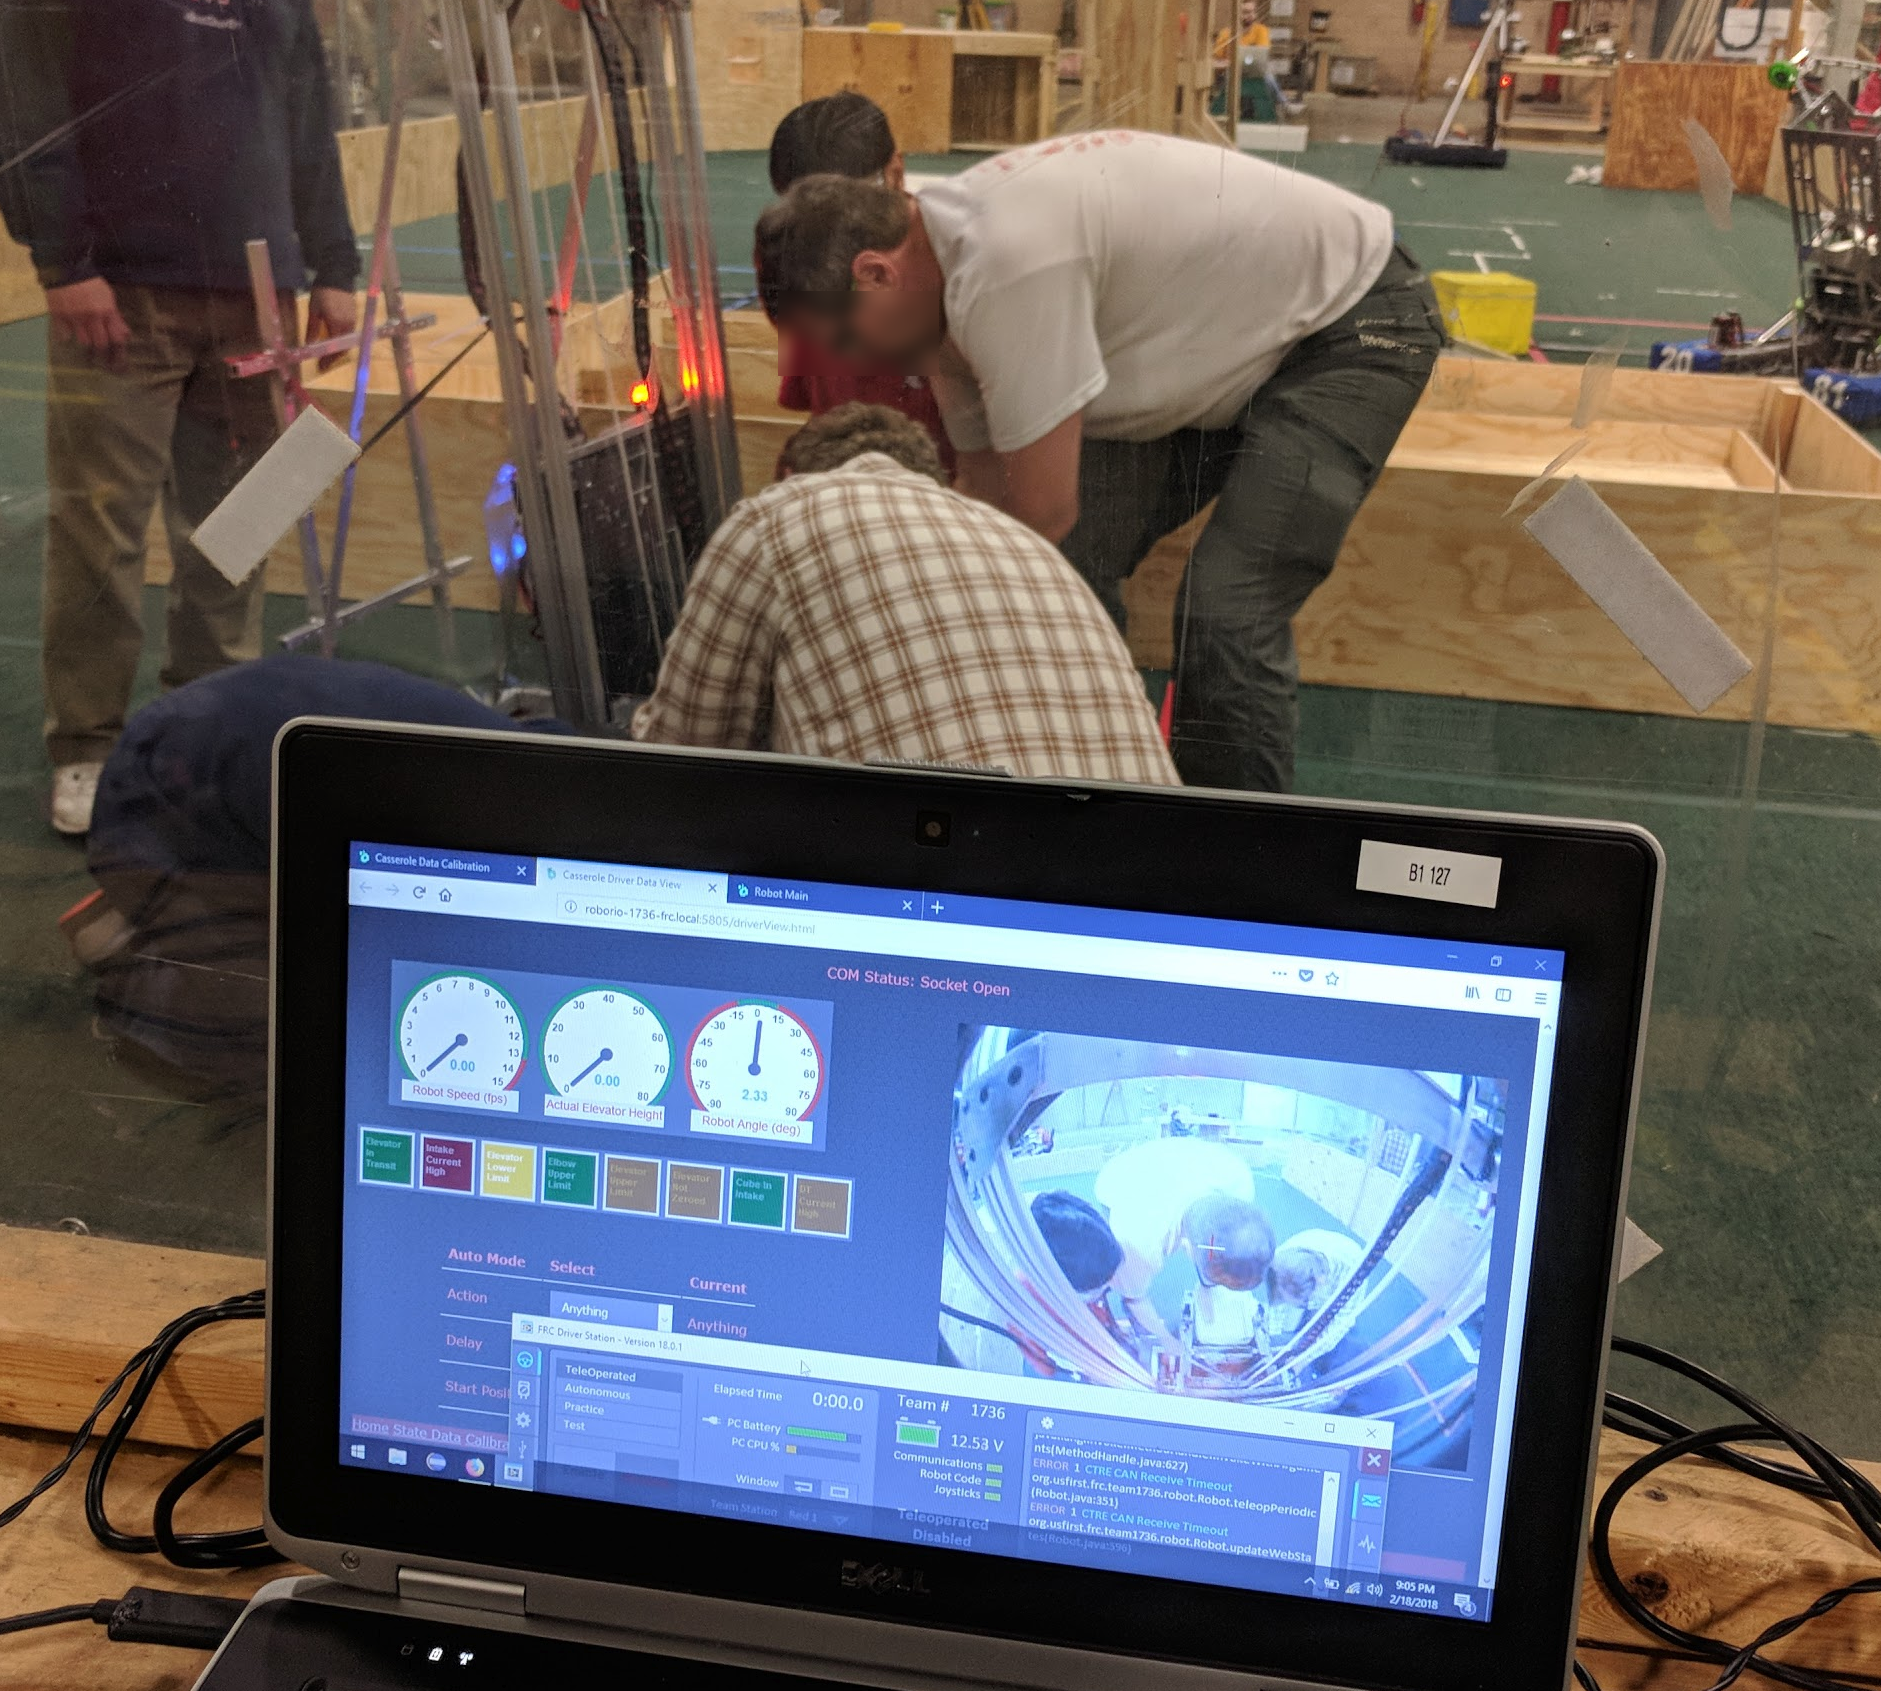
Although it can certainly be used by one person on one computer, I especially like that this system opens the door for multiple students to get involved at the same time. At the peak, we can have up to four computers with groups of students at each:
- Driver Station Computer
- Has the FRC driver station, controllers, and driver dashboard website pulled up
- Two students to operate the robot and execute the test sequences desired
- Calibrations Computer
- Has the calibrations webpage pulled up
- One student enters new calibration values as needed
- Data Viewing Computer
- Has the real-time data plots page pulled up
- One or more students getting data captures from tests run on the robot, and doing analysis of the results of calibration
- Software Development Computer
- Has one or more students making changes to software, as required.
On top of all of that, you would have one or more students or mentors coordinating the efforts - deciding the “run list” of tests, giving input on what cal values to change and why, and overall making the whole experience educational.
Obviously, not all of these have to be separate people and roles, but it’s really good to help get more than just one software student engaged in the development process. It ensures that even if you’re not the actual person typing in the code, you still have an understanding of how the robot is working and why things are done in certain ways. It’s (hopefully) inspirational, shows the depth of jobs one can have in an engineering organization, and prepares many students to talk to judges intelligently about the robot’s operation.
Conclusion
Doing something like this from the ground up is not for everyone. As you can see, it involves a lot of different technologies integrated together, which ultimately don’t produce any value unless you find yourself tuning robot behavior on a regular basis. It was built up around the
I’m not sure if this will ever get rolled out to all FRC teams. Casserole would be thrilled if you pick it up and find it useful! However, it’s not without fault. If I were to roll this system out to all FRC teams, I’d redesign it from the ground up.
For one thing, the implementation would probably be in C++ for tight integration into the existing WPILib frameworks.
Additionally, I’d want to rework the multithreading architecture. What we have works, but doesn’t make it very clear where data passes boundaries between threads. I’m sure there are race conditions we’re just not activating on a frequent basis - better design and documentation would help catch these.
This thing definitely needs some unit tests. Testing is mostly done by-hand, and big overhauls require a summer to do.
Finally, the dataviewer website could use some improvements. Being able to have multiple stacked plot windows will help looking at multiple data points at once. Being able to manipulate where signals show up after capturing them, or save recordings directly to CSV would also be welcomed additions.
But, despite these faults, it still helps us greatly in the tuning & software development workflows we have established on Casserole. It’ll likely be the defacto solution going forward, though that depends on whether we’re able to get our summer evaluations done as planned. The important part is that it helps us get our work done faster and more efficiently, and that’s really what anyone building a robot should care about.
Cheers! Stay home, stay healthy, and look forward to great things to come!
-
A note on terminology: Most industries (including mine) refer to the process of tuning values on the real device as “Calibration”, and the people who do it “Calibration Engineers”. However, since this blog post explicitly uses “Calibration” to refer to the software object which facilitates this process, I’m purposefully differentiating my calling the process itself “tuning”. Forewarning: if you talk to me in person, I probably will get sloppy and start using “calibration”. ↩
-
FWIW, Highsoft is an awesome company. They were super pumped when we told them how we were using their products, and did a blog post write-up on it ↩